|
|


Plotting a map of sea-level pressure is easy, and follows the basic commands. For the image above, we will set the appropriate domain and use a polar-stereographic map projection. The following commands set up the domain, open the data file and plot the sea-level pressure.
'sdfopen http://nomads.ncep.noaa.gov:9090/dods/gfs_hd/gfs_hd20130502/gfs_hd_12z'
'set display color white'
'clear'
'set map 1'
'set mpdset hires'
'set mproj nps'
'set lat 20 55'
'set lon -140 -60'
These commands by themselves will give you the "Before" image. Now the tricky part, using the mfhilo function, and grabbing the pressure centers.
the mfhilo function is another one of those functions that works with arguments. A full list and description of the different options can be found here. For the example here, I will use the contour level method to find maxima/minima in the sea-level pressure field. Basically, this method uses looks for minima/maxima that cross certain thresholds and are certain distances apart from other minima/maxima. You can tweak the threshold values as desired to get the right number of marks on your plot. Through trial and error I have found that a Radius of ~1000 and a contour interval of ~300 works fairly well with SLP maps. So the command to find low pressure centers is:
'mfhilo prmslmsl/100 CL l 1000, 300'
say result
The preceding commands will output this to the screen:
mfhilo CL method N: 4 maxmin: -1 radinf: 1000.0 [nm] cintinf: 300.0 lat
c: 37.50 lonc: -100.00
L 21.97 -90.35 M: 1009.81 D: 1829.44
L 24.88 -109.54 M: 1011.32 D: 1056.93
L 21.26 -70.10 M: 1013.5 D: 597.76
L 39.05 -89.04 M: 1019.76 D: 524.40
Now we have salient information about four low pressure centers: Lat, Lon, and Value. So, now getting this data printed to the screen is only a matter parsing this information. The first thing we will do is save this information into a new variable.
Low_info=result
Now, we have the information saved, we need to run through each minima. We can do this through a conditional loop, checking to make sure that the first word of the each line is an L. Then simply count through each line until this condition is not met. So our code to draw L's all over the map looks like this:
i=2 ;*Since the data starts on the 2nd line
while(subwrd(minmax,1) = 'L')
min_lat = subwrd(minmax, 2)
min_lon = subwrd(minmax, 3)
min_val = subwrd(minmax, 5)
'q w2xy 'min_lon' 'min_lat ;*converts lat/lon to page coordinates
x_min = subwrd(result,3) ;*finds page coordinates for x
y_min = subwrd(result,6) ;*finds page coordinates for y
'set strsiz .28'
'set string 2 c 9'
'draw string 'x_min' 'y_min' L'
'set strsiz 0.1'
'set string 2 bl 2'
'draw string 'x_min+0.1' 'y_min-0.15' 'min_val
i=i+1
minmax = sublin(Low_info,i)
endwhile
However, this is not good enough. I tweaked some of the domain settings to show why this is an issue, but often times, these maxima/minima will occur near the edge of the plot, and the L's and H's can get drawn overlapping the map border, which is just messy looking. An example is shown below.
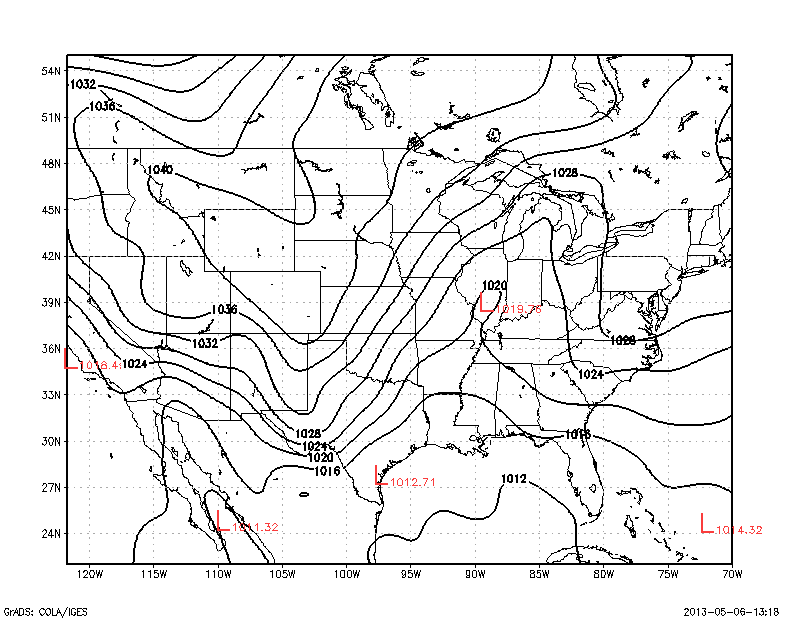 | |
| Example showing data plotted off of the map. |
To get around this, you must input an "invisible" boundary that keeps the script from plotting L's too close to the edges. There is more than one way to do this, the way that I do it is by replacing the block of code that draws the L's with this:
'q gxinfo'
xline=sublin(result,3)
yline=sublin(result,4)
xs=subwrd(xline,4)' 'subwrd(xline,6) ;*Gets x boundaries
ys=subwrd(yline,4)' 'subwrd(yline,6) ;*Gets y boundaries
* Conditional Statement requiring the L's be some distance away from the plot boundaries.
if(y_min > subwrd(ys,1)+0.1 & y_min < subwrd(ys,2)-0.1 & x_min > subwrd(xs,1)+0.1 & x_min < subwrd(xs,2)-0.5)
'set strsiz .28'
'set string 2 c 9'
'draw string 'x_min' 'y_min' L'
'set strsiz 0.1'
'set string 2 bl 2'
'draw string 'x_min+0.1' 'y_min-0.15' 'min_val
endif
By doing this, you prevent messy plots with L's and H's plotted outside of the page area. With this correction, the previous plot now looks like this.
 |
| Corrected, with invisible boundaries |
Once you have plotted the L's you need to plot the H's. This requires essentially the exact same block of code, only now the mfhilo function looks for maxima instead of minima, and you change the color of your plotted letter. When it put it all together, you get this long chunk of code here:
* ******************************DRAW L's******************************
'mfhilo prmslmsl/100 CL l 1000, 300'
Low_info=result
i=2 ;*Since the data starts on the 2nd line
minmax=sublin(Low_info,i)
while(subwrd(minmax,1) = 'L')
min_lat = subwrd(minmax, 2)
min_lon = subwrd(minmax, 3)
min_val = subwrd(minmax, 5)
'q w2xy 'min_lon' 'min_lat ;*Translate lat/lon to page coordinates
x_min = subwrd(result,3)
y_min = subwrd(result,6)
'q gxinfo' ;*Get area boundaries
xline=sublin(result,3)
yline=sublin(result,4)
xs=subwrd(xline,4)' 'subwrd(xline,6)
ys=subwrd(yline,4)' 'subwrd(yline,6)
if(y_min > subwrd(ys,1)+0.1 & y_min < subwrd(ys,2)-0.1 & x_min > subwrd(xs,1)+0.1 & x_min < subwrd(xs,2)-0.5)
'set strsiz .28'
'set string 2 c 9'
'draw string 'x_min' 'y_min' L'
'set strsiz 0.1'
'set string 2 bl 2'
'draw string 'x_min+0.1' 'y_min-0.15' 'min_val ;*Plots value to the lower right of the L
endif
i=i+1
minmax = sublin(Low_info,i)
endwhile
* ******************************DRAW H's******************************
'mfhilo prmslmsl/100 CL h 1000, 300'
High_info=result
i=2 ;*Since the data starts on the 2nd line
minmax=sublin(High_info,i)
while(subwrd(minmax,1) = 'H')
min_lat = subwrd(minmax, 2)
min_lon = subwrd(minmax, 3)
min_val = subwrd(minmax, 5)
'q w2xy 'min_lon' 'min_lat ;*Translate lat/lon to page coordinates
x_min = subwrd(result,3)
y_min = subwrd(result,6)
'q gxinfo' ;*Get area boundaries
xline=sublin(result,3)
yline=sublin(result,4)
xs=subwrd(xline,4)' 'subwrd(xline,6)
ys=subwrd(yline,4)' 'subwrd(yline,6)
if(y_min > subwrd(ys,1)+0.1 & y_min < subwrd(ys,2)-0.1 & x_min > subwrd(xs,1)+0.1 & x_min < subwrd(xs,2)-0.5)
'set strsiz .28'
'set string 4 c 9'
'draw string 'x_min' 'y_min' H'
'set strsiz 0.1'
'set string 4 bl 2'
'draw string 'x_min+0.1' 'y_min-0.15' 'min_val ;*Plots value to the lower right of the H
endif
i=i+1
minmax = sublin(High_info,i)
endwhile
So the code for this is kind of long, but most of it is translating lat/lon to page coordinates so that you can draw your L's and H's in the right place, and so that you don't plot them too close to the edges of your plot. But now you are all set to make sea-level pressure maps with L's and H's' Like I said, a radius of 1000 and a contour interval of 300 usually is a good balance between too many and too few marks, it's best for you to experiment with it until you come to a few settings you are comfortable with, so in the downloadable script, I set these two variables at the top so you can change them around easily.
Download this script


I get "Unknown command: mfhilo" which is likely because I don't have user defined functions. How to add these in GrADS 2? This would suggest to add env variable, but the directory /udf referenced does not exist in my /grads directory... http://www.iges.org/grads/gadoc/gradcomdgrads.html
ReplyDeleteHi, I've been trying this script and whilst it appears to run fine, with no obvious errors, I get no L or H symbols displayed on my map, I'm confused...
ReplyDeleteThis tutorial is very helpful for learning how to plot pressure centers on a map.
ReplyDelete