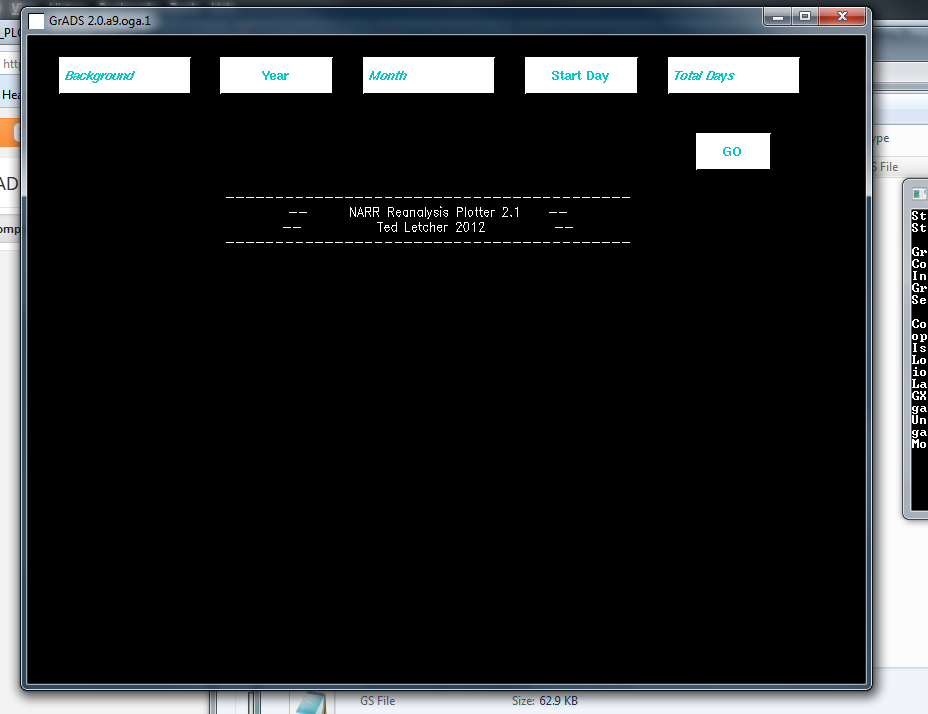
This script uses the GrADS widgets to create a GUI for generating quick data plots using data from the North American Regional Reanalysis (NARR). This GUI is an excellent way to quickly and easily make images using the NARR dataset... Read More: Script Page | Download Here
It can be difficult to plot a Skew-T diagram with the online NARR data using the plotskew.gs script provided by COLA. So I put together a small script using the plotskew function that will perform all of the unit conversions for you... Read More:Script Page | Download Here
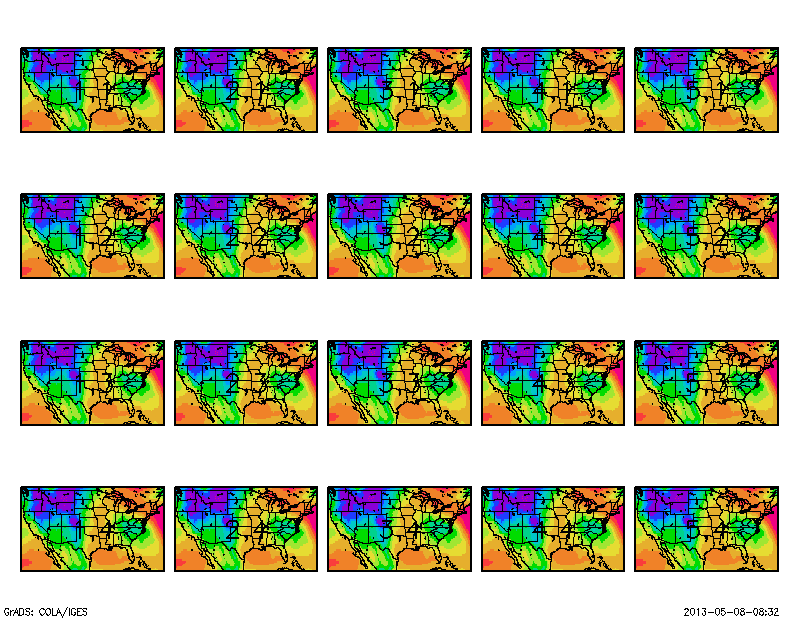
This script provides a simple way to set your plot area to fit into a user-specified grid of plots, similar to Pythons "subplot"... Read More: Script Page | Download Here
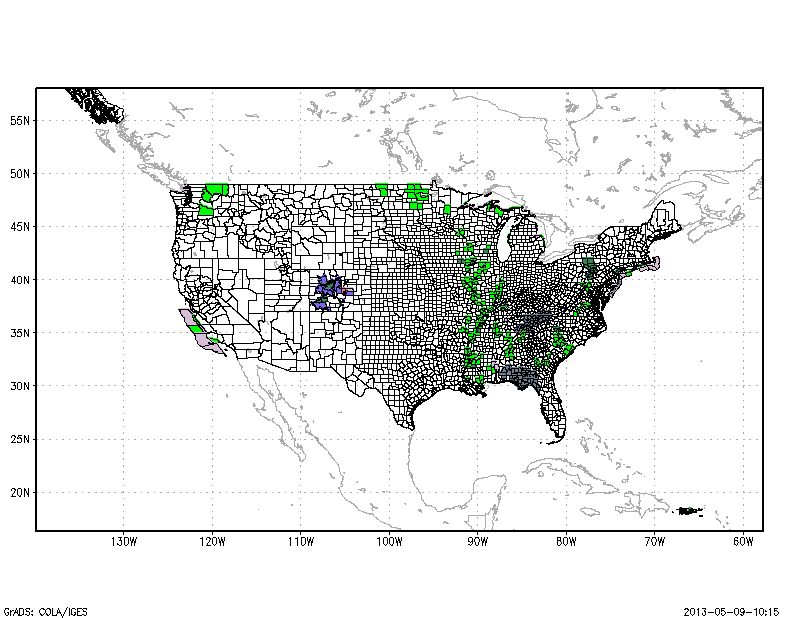
This is a script that decodes and plots color-filled shapefiles of various weather hazards.... Read More: Script Page | Download Here
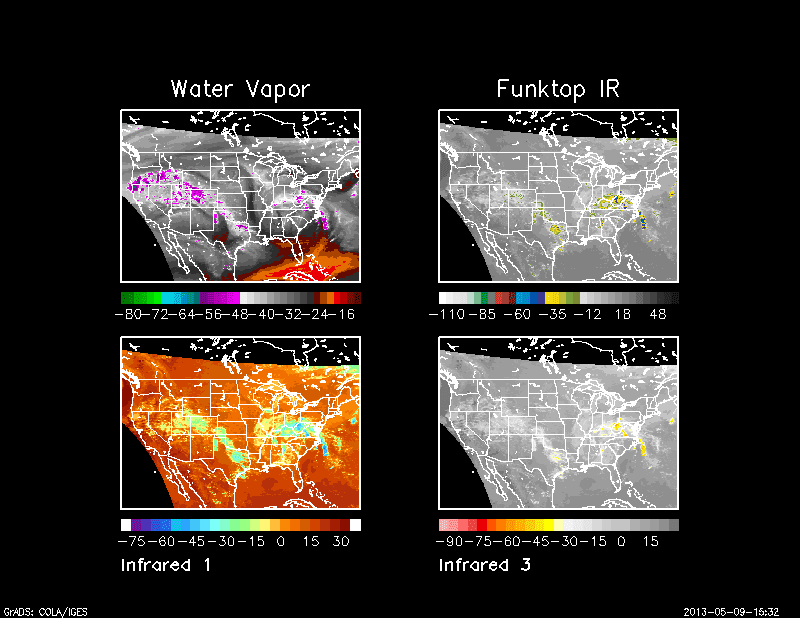
It can be tough to approximate the color scales often used to plot variables such as RADAR reflectivity or infrared satellite. This script makes sets the color scales up for a lot of these common settings... Read More: Script Page | Download Here
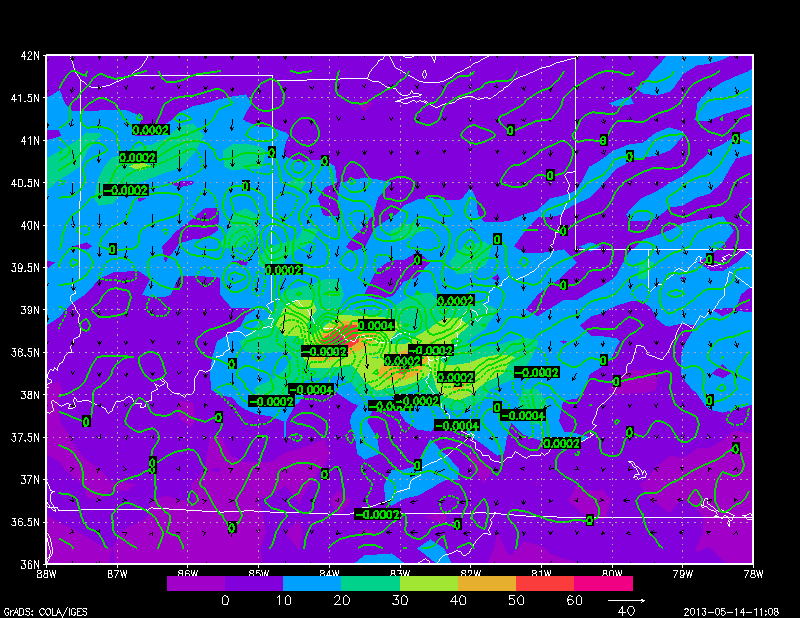
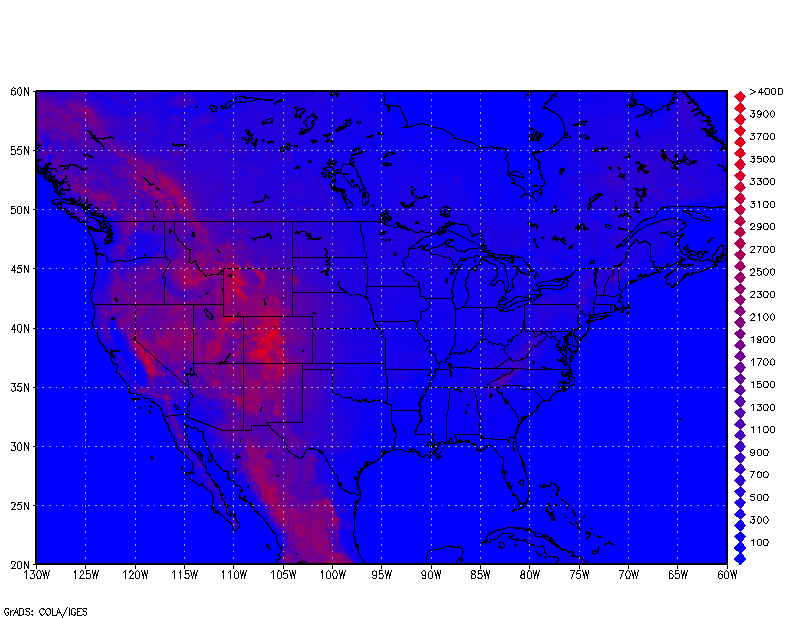
This script allows you to calculate and plot numerous advanced dynamic variables from standard weather model output... Read More: Script Page | Download Here
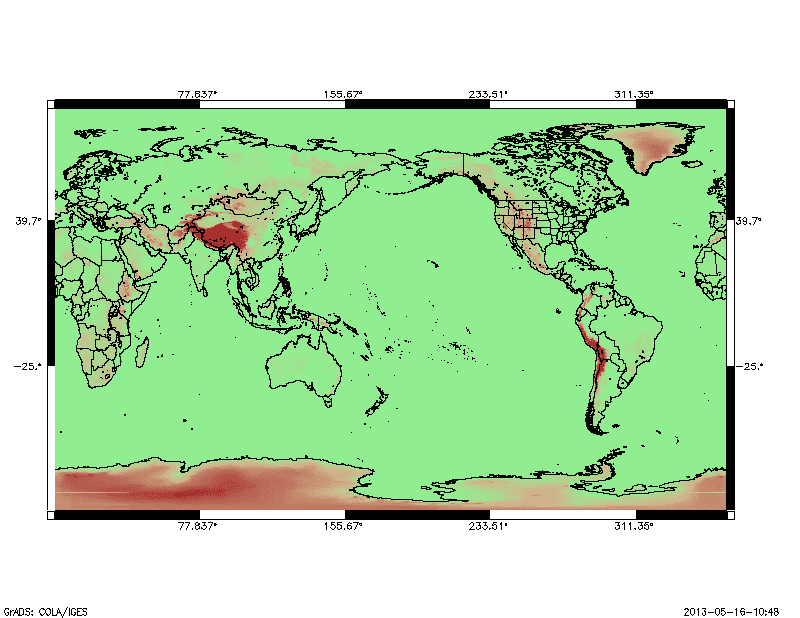
This script helps you create more professional looking area maps by plotting a clean border around your map... Read More: Script Page | Download Here
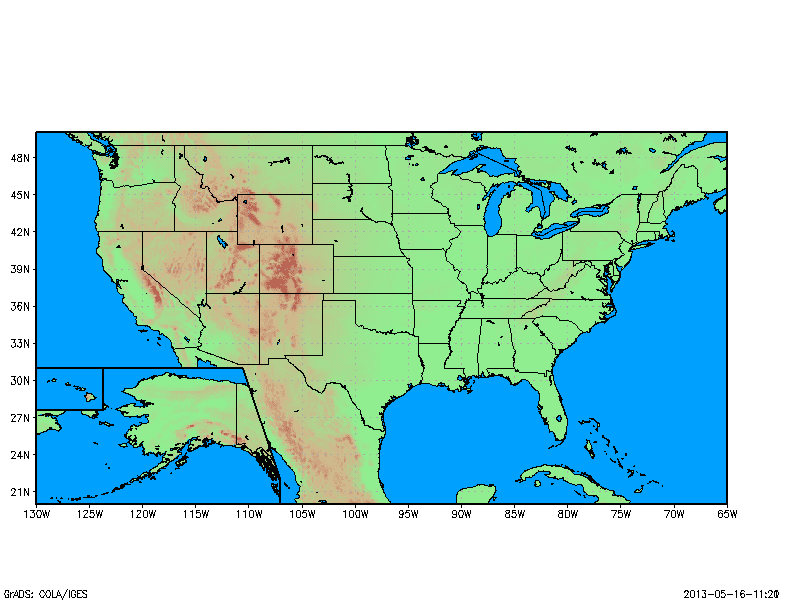
This script gives you the ability to generate the classic US map that has helped convince countless of Americans that Alaska is really an island near Mexico, and not a giant landmass far to the north... Read More: Script Page | Download Here
This function reads in temperature and moisture information and returns a good approximation of both potential and equivalent potential temperature... Read More: Script Page | Download Here
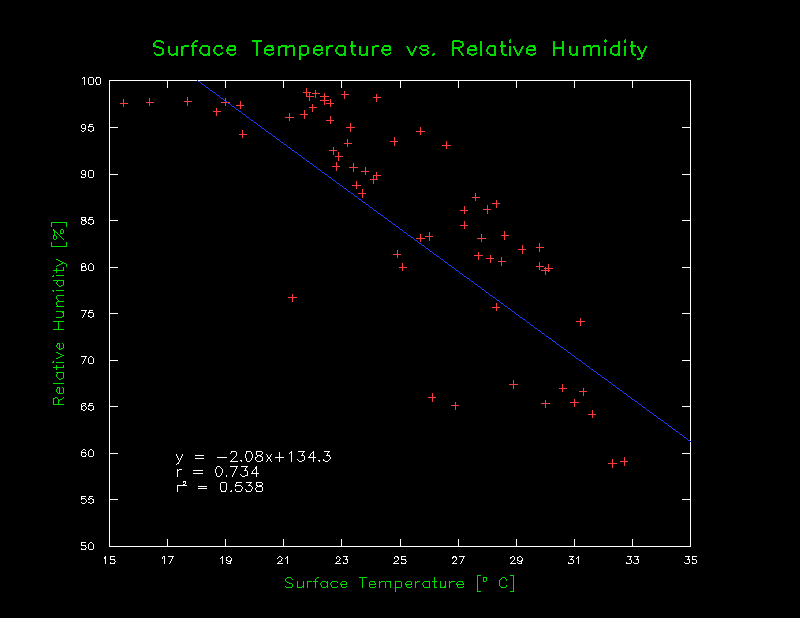
This script not only makes it possible, but easy to plot 2D scatter or line plots in GrADS using user specified arrays... Read More: Script Page | Download Here
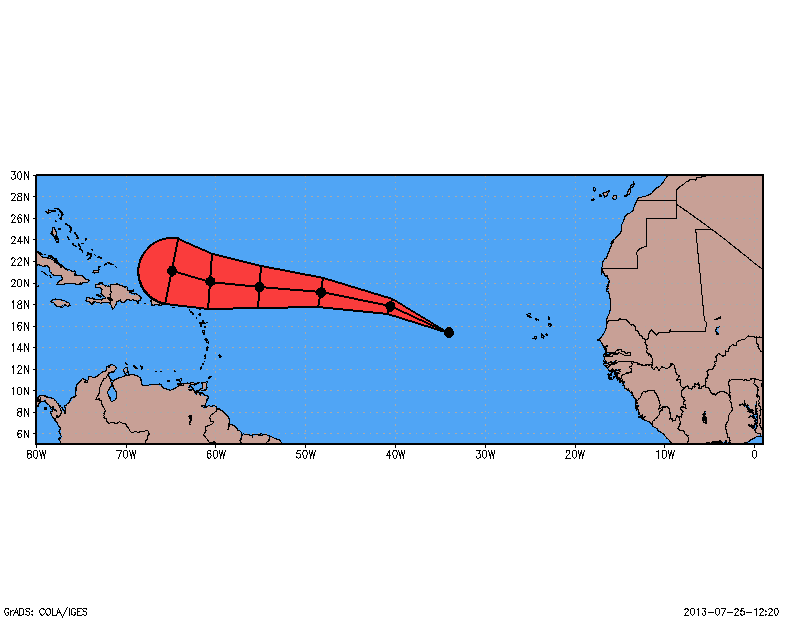
This script draws a cone around the storm track based on user input options for error... Read More: Script Page | Download Here
The newest version of the NARR Plotter (v2.2) has finally been finished, tested, and debugged. The new version is an update to the previous NARR Plotter v2.1, which provides a GUI interface to the NARR dataset available from NOMADS... Read More: Script Page | Download Here
This is another one of those scrips that extends the flexibility of GrADS beyond it's intended purpose and might be useful for generating quick statistics on data sets that are in GrADS format without the intermediary step of saving data to a file to read into another program... Read More: Script Page | Download Here
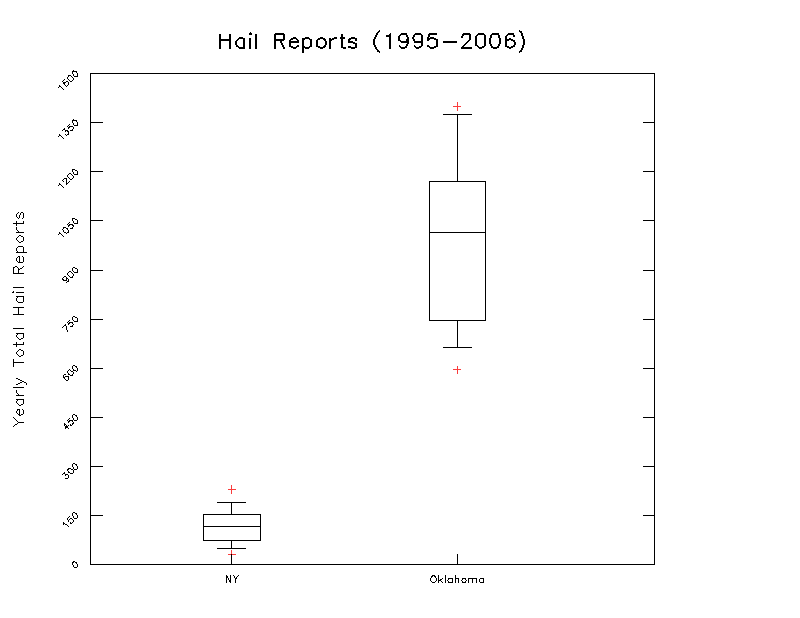
Boxplot takes data from a user input array in the form of a string with array elements separated by spaces (same as scatter.gs) and plots out a box plot using that data... Read More: Script Page | Download Here
Recently I have seen a few presentations that showed figures that had color bars made up of diamonds rather than rectangles (see below). I figured it might be fun to put together a quick script that allows you to do this in GrADS... Read More: Script Page | Download Here
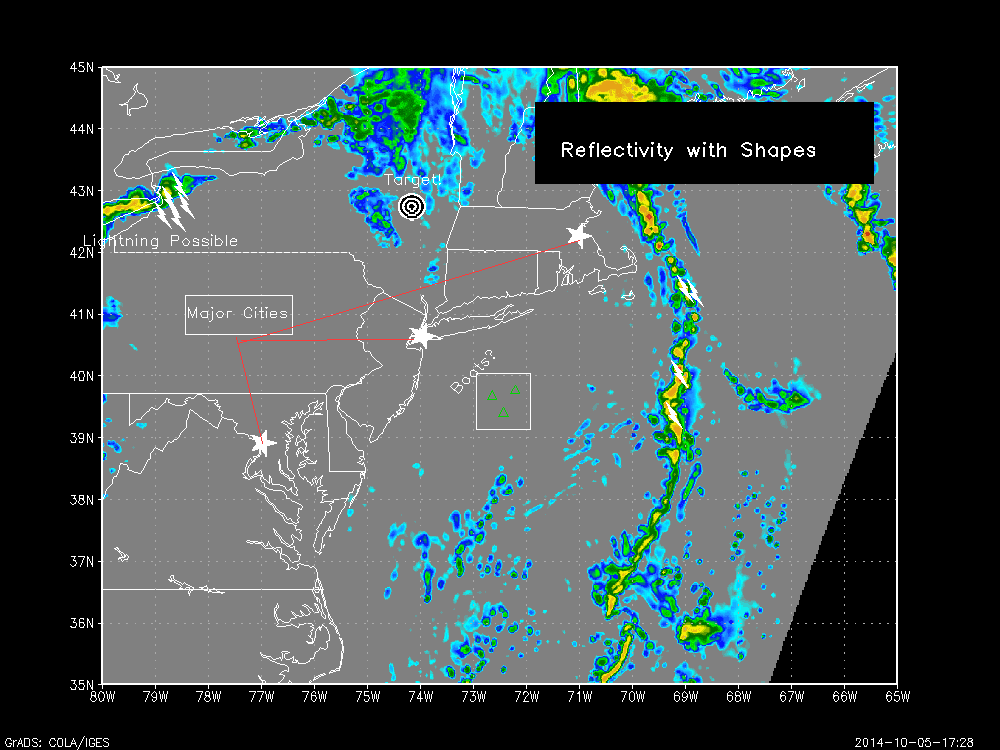
A basic GUI script designed to make drawing shapes, or adding text to any plot easy! In addition to the basic marks and lines, this script also allows you to draw lightning bolts, stars, and bulls-eyes... Read More: Script Page | Download Here
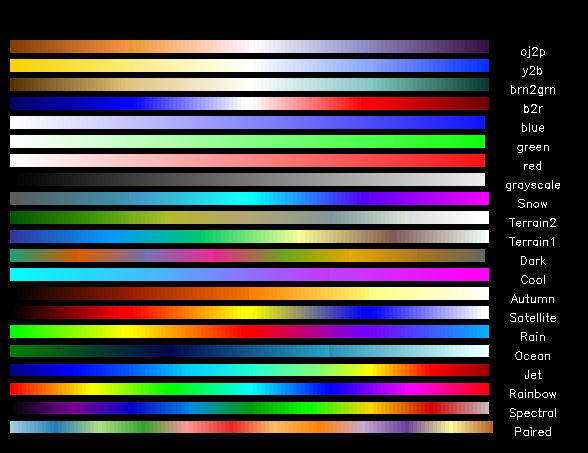
This script was created to make it easy to generate very pretty color scales for plotting. These maps are generally based off of preexisting color scales for matplotlib from python, or ncl, or other common color scales... Read More: Script Page | Download Here


I am searching for Vpage script for ploting more than one multiple graph in one plot
ReplyDelete