This is a script that decodes and plots color-filled shapefiles of various weather hazards. This is my first version of this script, so it is fairly rudimentary, but still useful as it loops through the somewhat complicated decoding process to determine the type and severity of each weather hazard. In addition, it incorporates the NOAA color table for hazardous weather, so it produces plots similar to the ones seen on the SPC homepage.
For this script to work, you must download the shapefiles under the header "GIS Watch/Warnings from this website. This script works with both current and archived warnings.
Usage:
'Warn_Plot -fo folder -fn filename -help'
There are no required inputs, the folder is default to the current directory, and the filename is default to the current weather warning shapefile. The option -help(-h) brings up a short help manual on how to use this script.
Usage Notes and Caveats:
Example Plot:
'set display color white'
'clear'
'sdfopen http://nomads.ncep.noaa.gov:9090/dods/rap/rap20130509/rap_00z'
'set mpdset hires'
'set clevs 100000'
'd capesfc'
'set line 1'
'draw shp Shapefiles/c_02ap13.shp'
WarnFold='WARNINGS/'
fname='wwa_201302011010_201302011215'
'Warn_Plot -fo 'WarnFold
It is possible that I might include an option to plot a legend in future versions, but that is a possibility for a later date. In the meantime enjoy, and please report any bugs you find in this script so I may fix them in future versions.
Download Warn_Plot.gs
Download Example Script
For this script to work, you must download the shapefiles under the header "GIS Watch/Warnings from this website. This script works with both current and archived warnings.
Usage:
'Warn_Plot -fo folder -fn filename -help'
There are no required inputs, the folder is default to the current directory, and the filename is default to the current weather warning shapefile. The option -help(-h) brings up a short help manual on how to use this script.
Usage Notes and Caveats:
- The colorscale matches pretty close to the colorscale seen on the SPC hazards map
- Slight differences due to 'watch/warning' classification
- Counties/Polygons with multiple hazards are decided based on hazard classification, not type. The following list shows the order of importance, with warnings as highest importance and statement as lowest importance
- Statement
- Advisory
- Watch
- Warning
- Example of overwrite: Flood Warning overwrites a Flood Watch, but Severe T-storm Warning does not overwrite a Flood Warning
- Use with archived data is not heavily tested, so it is possible there are errors that may show up with this, but so far I haven't run across any issues
Example Plot:
'set display color white'
'clear'
'sdfopen http://nomads.ncep.noaa.gov:9090/dods/rap/rap20130509/rap_00z'
'set mpdset hires'
'set clevs 100000'
'd capesfc'
'set line 1'
'draw shp Shapefiles/c_02ap13.shp'
WarnFold='WARNINGS/'
fname='wwa_201302011010_201302011215'
'Warn_Plot -fo 'WarnFold
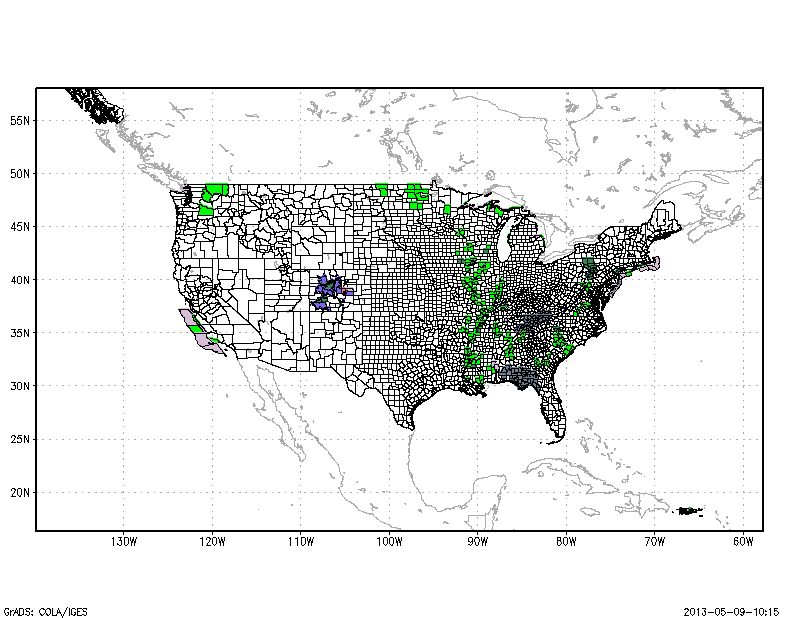 |
| Example output image from Warn_Plot |
It is possible that I might include an option to plot a legend in future versions, but that is a possibility for a later date. In the meantime enjoy, and please report any bugs you find in this script so I may fix them in future versions.
Download Warn_Plot.gs
Download Example Script


