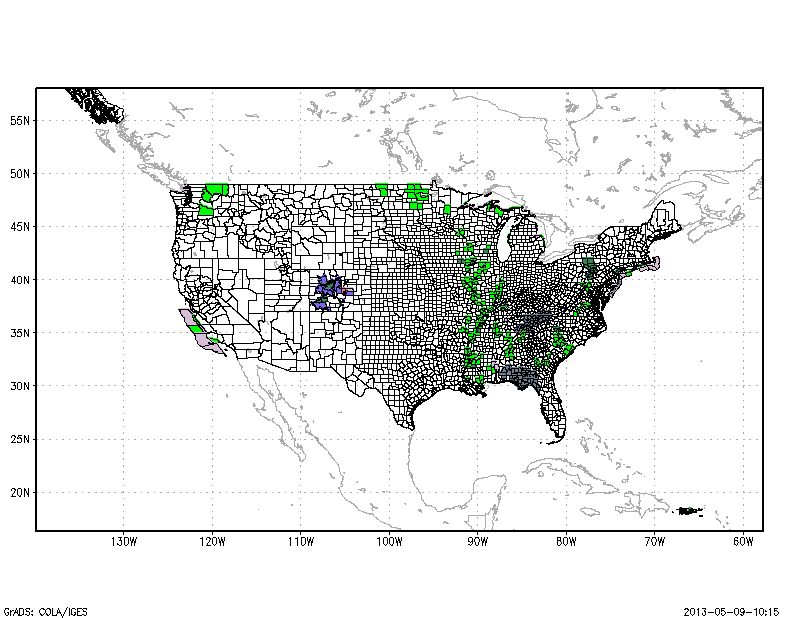
For this script to work, you must download the shapefiles under the header "GIS Watch/Warnings from this website. This script works with both current and archived warnings.
Usage:
'Warn_Plot -fo folder -fn filename -help'
There are no required inputs, the folder is default to the current directory, and the filename is default to the current weather warning shapefile. The option -help(-h) brings up a short help manual on how to use this script.
Usage Notes and Caveats:
- The colorscale matches pretty close to the colorscale seen on the SPC hazards map
- Slight differences due to 'watch/warning' classification
- Counties/Polygons with multiple hazards are decided based on hazard classification, not type. The following list shows the order of importance, with warnings as highest importance and statement as lowest importance
- Statement
- Advisory
- Watch
- Warning
- Example of overwrite: Flood Warning overwrites a Flood Watch, but Severe T-storm Warning does not overwrite a Flood Warning
- Use with archived data is not heavily tested, so it is possible there are errors that may show up with this, but so far I haven't run across any issues
Example Plot:
'set display color white'
'clear'
'sdfopen http://nomads.ncep.noaa.gov:9090/dods/rap/rap20130509/rap_00z'
'set mpdset hires'
'set clevs 100000'
'd capesfc'
'set line 1'
'draw shp Shapefiles/c_02ap13.shp'
WarnFold='WARNINGS/'
fname='wwa_201302011010_201302011215'
'Warn_Plot -fo 'WarnFold
 |
| Example output image from Warn_Plot |
It is possible that I might include an option to plot a legend in future versions, but that is a possibility for a later date. In the meantime enjoy, and please report any bugs you find in this script so I may fix them in future versions.
Download Warn_Plot.gs
Download Example Script


0 comments:
Post a Comment