It is called, by providing the script with the total number of rows and columns, as well as the specified row/column for your chosen plot. You can access a short help page by calling without the proper variables.
Example useage: 'set_parea 3 5 2 3'
This example, will set the page area to be the center of a 3x5 grid, row 2 column 3.
Options: -margin (-m): sets margins from the page edges and in between each plot.
-show (-s): clears the screen and plots/labels all page areas.
An example of the -show option is shown below:
'set_parea 4 5 2 3 -m 0.3 -s'
 |
| Example using -show option in set_parea.gs |
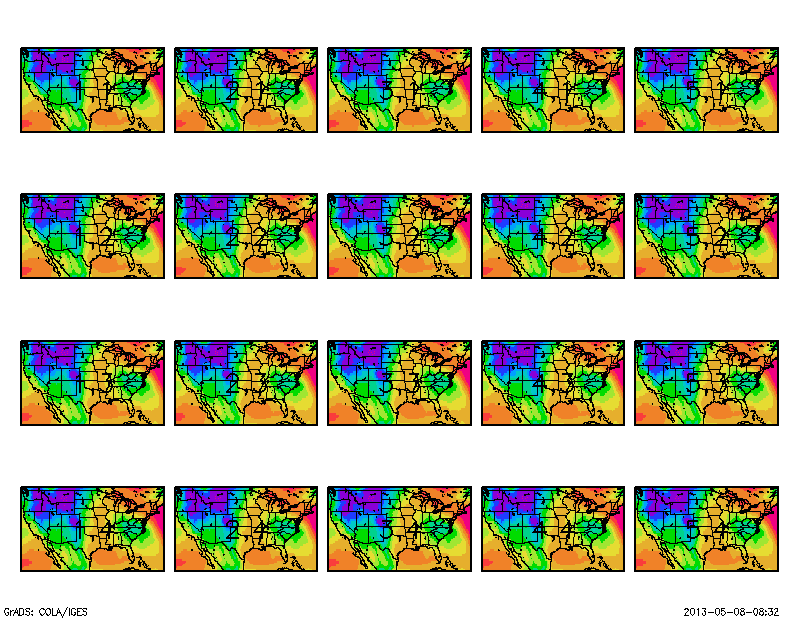
One potential use for this script would be to plot model output variables at all time steps on one plot. An example script to do this is shown below, and plots 18 time steps from the RAP model.
'sdfopen http://nomads.ncep.noaa.gov:9090/dods/rap/rap20130507/rap_00z'
'set lat 22 50'
'set lon -125 -68'
'set gxout shaded'
'set mpdset hires'
'set display color white'
'clear'
'set xlab off'
'set ylab off'
rows=4
cols=5
t=1
i=1
j=1
while(t<=18)
'set t 't
if(j>cols);i=i+1;j=1;endif
'set_parea 'rows' 'cols' 'i' 'j' -m 0.3'
'color 5 75 5 -kind white->dodgerblue->blue->lime->green->darkgreen->yellow->goldenrod->orange->firebrick->red->darkred->fuchsia->indigo'
'd refcclm'
'draw title Time: 't
j=j+1
t=t+1
endwhile
Resultant Image:
 |
Download set_parea.gs
Download RAP Example Script


Kind of sweet juicy script. But this set_parea does not work on my computer. Is it older version of Grads?
ReplyDeleteWhat is the error that you get? Are you including at least the four required arguments? Show me how you are calling it, and I may be able to help.
ReplyDeleteHey I got it right
ReplyDeleteBut I have a question. I want to plot a color bar (one for each row) Can you help me with that.
cheers
The best way to plot a color bar for each row would be to use "xcbar.gs," which allows you to specify the x/y coordinates for your color bar. The way that I do this is by using the 'q gxinfo' command to get the plot area (using the sublin, and subwrd functions), and then calling xcbar.gs
ReplyDelete'xcbar 'x1' 'x2' 'y1' 'y2
Hope that helps!
I am trying to plot 2 by 2 plots of seasonal means of 40 yrs data. But only one of them gets plotted always as I set all the four plots.
ReplyDeleteHello,I am trying to plot a map (all times step in one panel) with: wind vector, SST and Topography (using 'sdfopen etopo2.nc')but I haven't been able to plot the topography!Can you help me?
ReplyDeleteHello, I was trying to plot 3 different maps from 3 different netcdf files following your script. However, it did not work out. Always missed the second map as it said "request is completely outside file limits" . Could you solve this problem?
ReplyDeleteHello, and thanks for sharing this script! I could not download it though, or find it anywhere else...could you please upload it again?
ReplyDeleteThanks heaps in advance
Carlos
Whether you’re looking to buy a plot for personal use or as an investment, Brajbhoomi Realty offers the best Property in Vrindavan. Our expert team is here to help you make the right choice. Don’t miss out on the chance to invest in one of India’s most spiritual and fast-growing cities!
ReplyDeletecan anyone please help in plotting panel plot for precipitation nasa gpm image data from5th july to 15th july,2025 also create a sub-plot for the highest rainfall rate during this time?
ReplyDelete