As we start to get into the meat of the northern hemisphere Hurricane season, I figured I would release a couple of entries related to hurricanes and tropical storms. The first of which is a script I recently put together called "cone.gs" This script helps plot one of those "uncertainty" cones showing the predicted storm track with potential deviations in it.
Now, I should mention that if you want to just plot the official Hurricane uncertainty cone, you can always read in the shapefile provided here. But, if you want to plot your own uncertainty track this script does a nice job!
This script basically uses the MFHILO function to find the storm center, and then draws a cone around the storm track based on your input options for error and everything else.
The example above also uses the 'basemap' script to plot the basemap. All that is required in the example call is the variable you want to use (in this case,sea level pressure).
Example:
'cone prmslmsl -fill -fcol 2 -circ -error 50 -dunit km -unit day -end 6 -tint 8'
This example uses many of the built in options:
-fill: Fills cone
-fcol: Fill color
-circ: Draws semi-circle on the end
-error: Radial error in units: dunit/tunit - in this example 50 km/day
-dunit: Distance unit for error
-tunit: Time unit for error
-end: Total number of time-steps to plot
-tint: Time interval to plot in timesteps.
The example above uses the GFS data (which runs on a 3 hour time step) to plot the cone. This block of code will produce the above image.
file='http://nomads.ncep.noaa.gov:9090/dods/gfs_hd/gfs_hd20130725/gfs_hd_00z'
'sdfopen 'file
'set display color white'
'clear'
'set mpdset hires'
'set lon -80 1'
'set lat 5 30'
'd hgtprs'
'rgbset'
'basemap L 74 1 M'
'basemap O 45 1 M'
'printim hurricanebase.png'
'clear'
'set t 3'
'set lat 5 30'
'set lon -80 1'
'set clevs 10000000'
'set ccolor 0'
'd hgtprs'
'set map 1'
'draw map'
'cone prmslmsl -mnlt 10 -maxlat 25 -mnln -70 -mxln -20 -tunit day -fcol 2'
'printim ucone.png -b hurricanebase.png -t 0'
The Important thing to note is the use of the maxlat/mnlat/etc... options. These options define an invisible boundary within your domain for which to search for the storm center, without these you can easily find min values that are not part of your storm, especially with larger domains. It is recommended that you use these options to help draw your cone. Also you will need the script basemap.gs and the associated .asc files.
That's about it, here are links to cone.gs and the example script above! Hope you all find this useful! Be sure to report any bugs here! Stay tuned for a tutorial on plotting numerous model predicted storm tracks on the same plot!
Download cone.gs
Download example script
Now, I should mention that if you want to just plot the official Hurricane uncertainty cone, you can always read in the shapefile provided here. But, if you want to plot your own uncertainty track this script does a nice job!
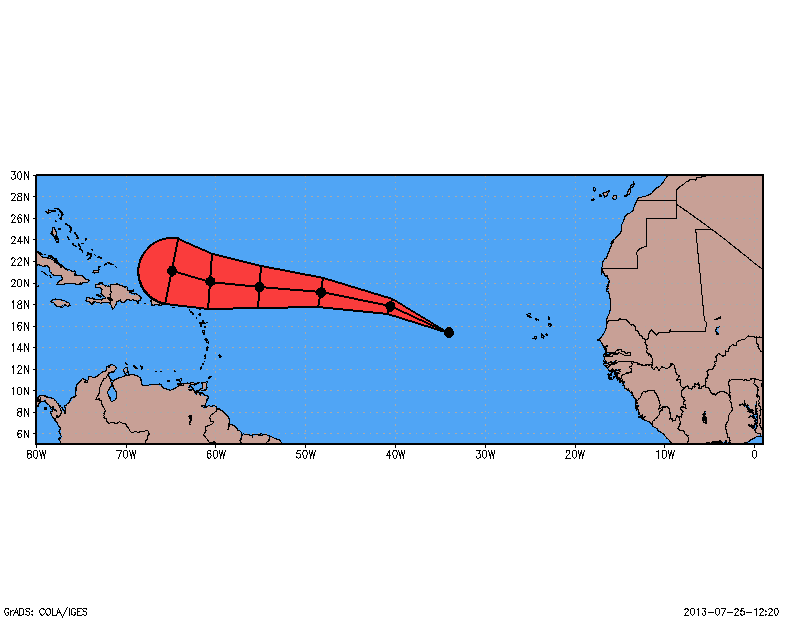 |
| Example: Tropical Storm Dorian, 6 day storm track |
This script basically uses the MFHILO function to find the storm center, and then draws a cone around the storm track based on your input options for error and everything else.
The example above also uses the 'basemap' script to plot the basemap. All that is required in the example call is the variable you want to use (in this case,sea level pressure).
Example:
'cone prmslmsl -fill -fcol 2 -circ -error 50 -dunit km -unit day -end 6 -tint 8'
This example uses many of the built in options:
-fill: Fills cone
-fcol: Fill color
-circ: Draws semi-circle on the end
-error: Radial error in units: dunit/tunit - in this example 50 km/day
-dunit: Distance unit for error
-tunit: Time unit for error
-end: Total number of time-steps to plot
-tint: Time interval to plot in timesteps.
The example above uses the GFS data (which runs on a 3 hour time step) to plot the cone. This block of code will produce the above image.
file='http://nomads.ncep.noaa.gov:9090/dods/gfs_hd/gfs_hd20130725/gfs_hd_00z'
'sdfopen 'file
'set display color white'
'clear'
'set mpdset hires'
'set lon -80 1'
'set lat 5 30'
'd hgtprs'
'rgbset'
'basemap L 74 1 M'
'basemap O 45 1 M'
'printim hurricanebase.png'
'clear'
'set t 3'
'set lat 5 30'
'set lon -80 1'
'set clevs 10000000'
'set ccolor 0'
'd hgtprs'
'set map 1'
'draw map'
'cone prmslmsl -mnlt 10 -maxlat 25 -mnln -70 -mxln -20 -tunit day -fcol 2'
'printim ucone.png -b hurricanebase.png -t 0'
The Important thing to note is the use of the maxlat/mnlat/etc... options. These options define an invisible boundary within your domain for which to search for the storm center, without these you can easily find min values that are not part of your storm, especially with larger domains. It is recommended that you use these options to help draw your cone. Also you will need the script basemap.gs and the associated .asc files.
That's about it, here are links to cone.gs and the example script above! Hope you all find this useful! Be sure to report any bugs here! Stay tuned for a tutorial on plotting numerous model predicted storm tracks on the same plot!
Download cone.gs
Download example script