Update (July 2013): Version 1.2: New color scales added:
- Visible Satellite
- Cloud top Height (From ucar)
- Wunderground RADAR reflectivity scales
- Rain
- Mix
- Snow
 |
| Example of colorset.gs using the Wunderground RADAR reflectivity color scale. |
Usage:
'colorset type'
The only required input is the desired colorscale. There are no optional inputs. A call with no specified scale brings up a short help page.
The following scales are currently available in colorset.gs:
- Water Vapor [C] (ucar): Vapor
- Color Infrared [C] (ucar): IR1
- Funktop Infrared [C] (NOAA): Funktop (IR2)
- AVN IR Scale [C] (NOAA): AVN (IR4)
- Color Enhanced IR [C] : IR3
- RADAR Reflectivity [dBZ] : Reflectivity (Rad1)
- RADAR Radial Velocity [kts] : Velocity (Rad2)
- RADAR Reflectivity [dBZ] (Wunderground - rain): Wrad1 (Wunder1)
- RADAR Reflectivity [dBZ] (Wunderground - mix): Wrad1 (Wunder2)
- RADAR Reflectivity [dBZ] (Wunderground - snow): Wrad3 (Wunder3)
- Cloud Top Height [KFt] (ucar): CTH (Cloud_Height)
- Visible Satellite [N/A] (NOAA): Vis (visible)
Example call:
'colorset IR2'
'd data'
This call will plot your data on the colorscale of funktop IR.
Notes:
- All satellite IR scales are in degrees Celcius, if your data is in Kelvin, please convert it before using colorset.gs.
- This script currently works best with observational data (Satellite and RADAR), but could be used with model data
- A greater number of colorscales may be included in the next version, so check back soon.
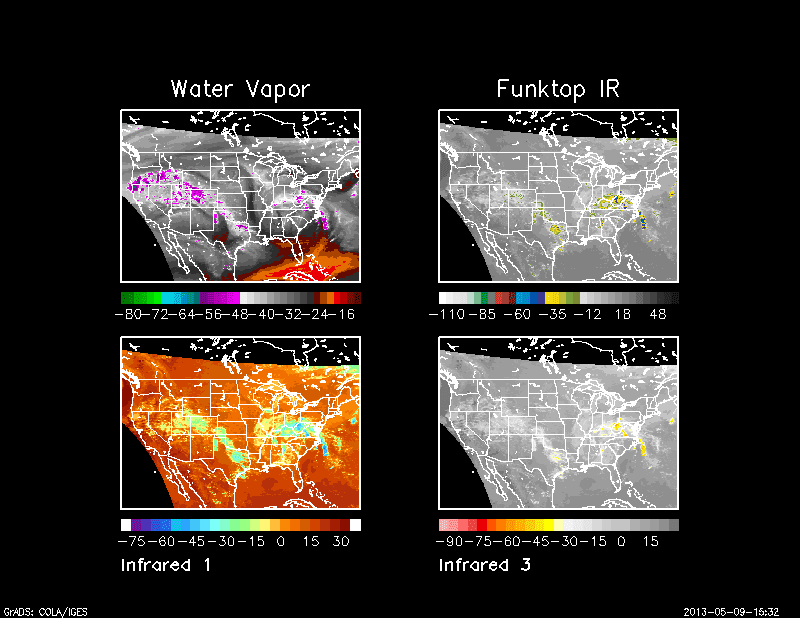 |
| colorset.gs example: IR satellite images |
Download colorset.gs


How would you go about plotting base reflectivity with precipitation types? Thanks in advance.
ReplyDeleteThis should get you started:
ReplyDeletehttps://gradsaddict.blogspot.com/2013/05/tutorialtwo-methods-to-plot-more-than.html
Thank you!
Delete