A new version of this script has been developed and can be found here.
This script uses the GrADS widgets to create a GUI for generating quick data plots using data from the North American Regional Reanalysis (NARR). This GUI is an excellent way to quickly and easily make images using the NARR dataset. This is the 2nd major overhaul of this script, and it includes a help page and a settings page. It should work just fine out of the box, but if you want to plot variables that are not listed on the drop down menus, you will need to edit the script itself (instructions on how to do this are on the help page). In any case, enjoy, and please report any bugs. Also, I'd love to hear your feedback.
In order for this script to run properly you must have these scripts in your scripts folder.
color.gs
xcbar.gs
Note: A newer version of this script is available here.
Example Images:
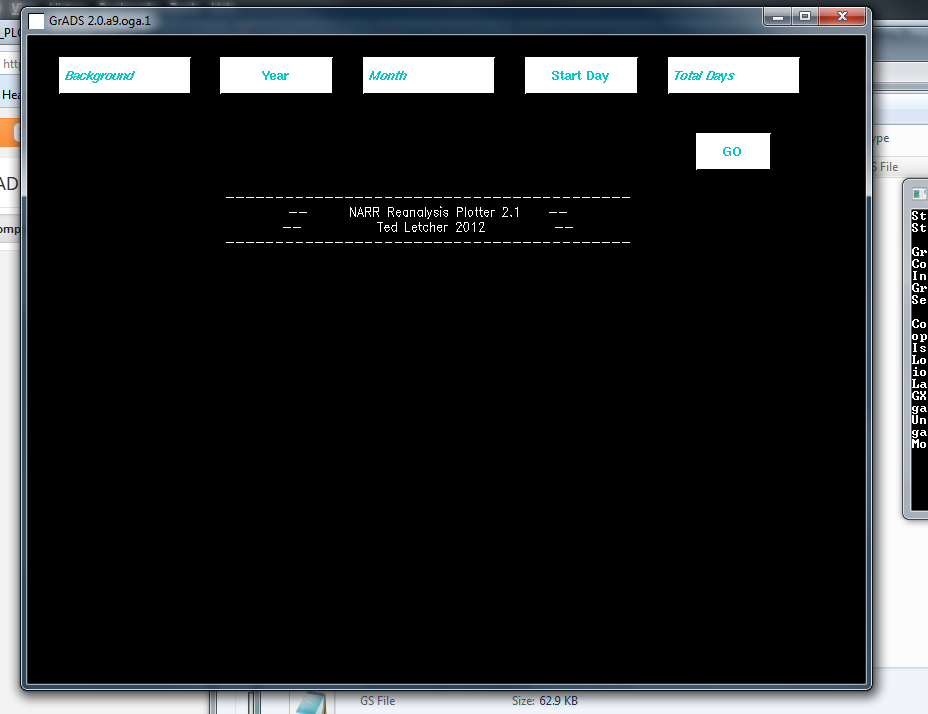 |
| Opening Screen |
 |
| Cross Section Screen |
|
| Plotting Screen |
Download Here


0 comments:
Post a Comment